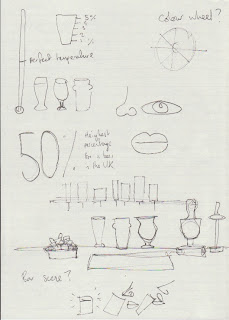
With infographics used to display data and statistics in visually interesting ways, I thought that beer would be a good example for varieties of beer and interesting facts. Although there are plenty of facts and statistics about beer, where-the or not they are useful is another matter. I feel in order for the design to be successful, the infographics needs to focus on more useful information like enjoying beer properly, tasting beer and knowing the differences. With plenty of varieties of beer, creating visuals purely on differences would be strong enough, instead of having to explaining 'how many guinness' were served last week' for example.
The focus- Differences in beers, how to enjoy different beers, Complimenting flavours with beer. Currently continuing with pictograms and laying out step by steps for ideas. I feel research into layouts and more content will definitely drive my designs further.


0 comments:
Post a Comment